Visualize Strengths & Weaknesses
Gain a deeper understanding of your employee experience data with Livingroom's interactive and colorful visualizations.


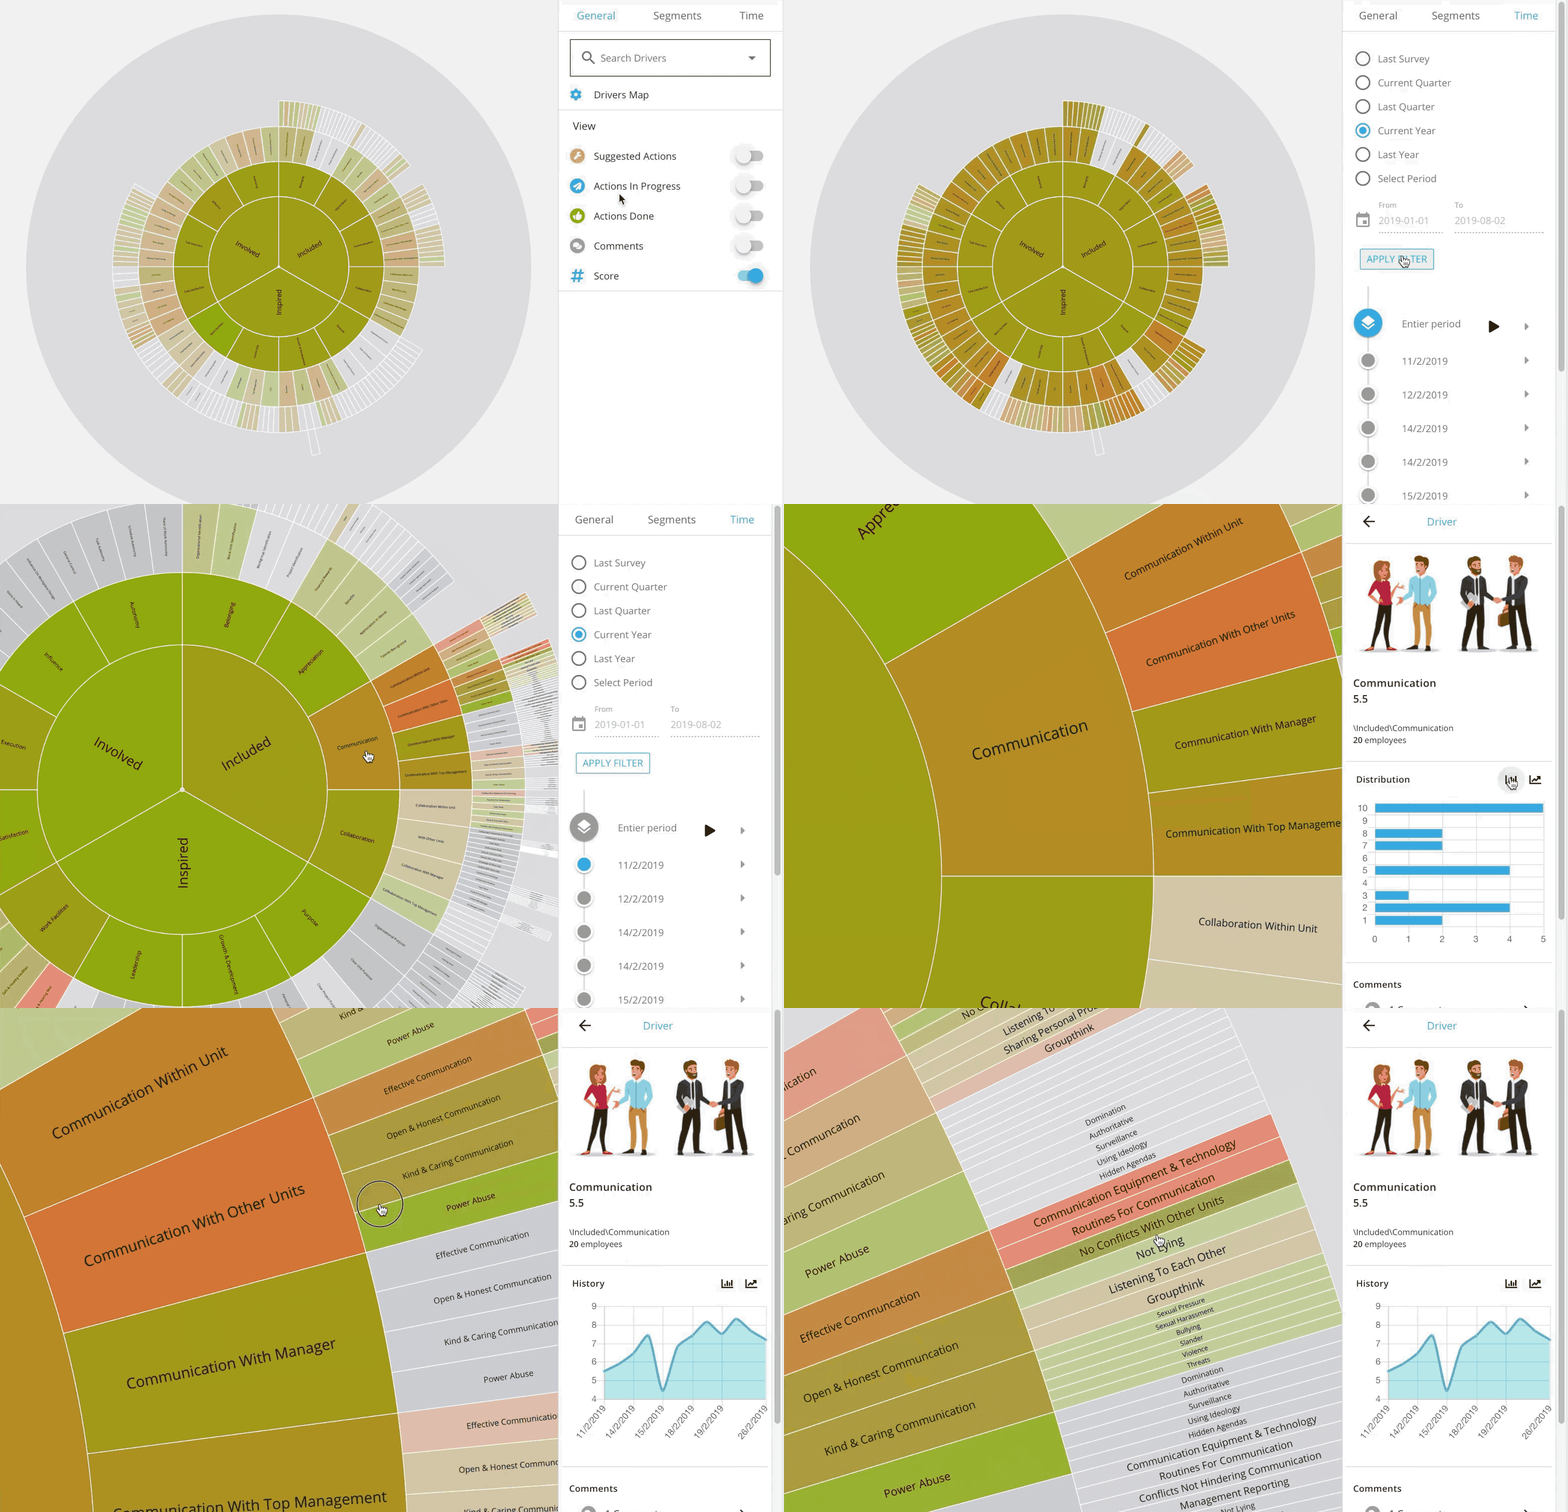
Explore Experience Drivers
With Livingroom's fine-grained, color-coded heatmap, managers can quickly identify strong and weak employee experience drivers. The heatmap illuminates data at different zoom levels and provides powerful insights into the strengths and challenges of the organization.
Map Journey Experiences
Every employee journey can be viewed as a set of data points. With Livingroom you can map and visualize the different steps in the journey, identify ineffective activities, compare alternatives through A/B testing and find your perfect journey.


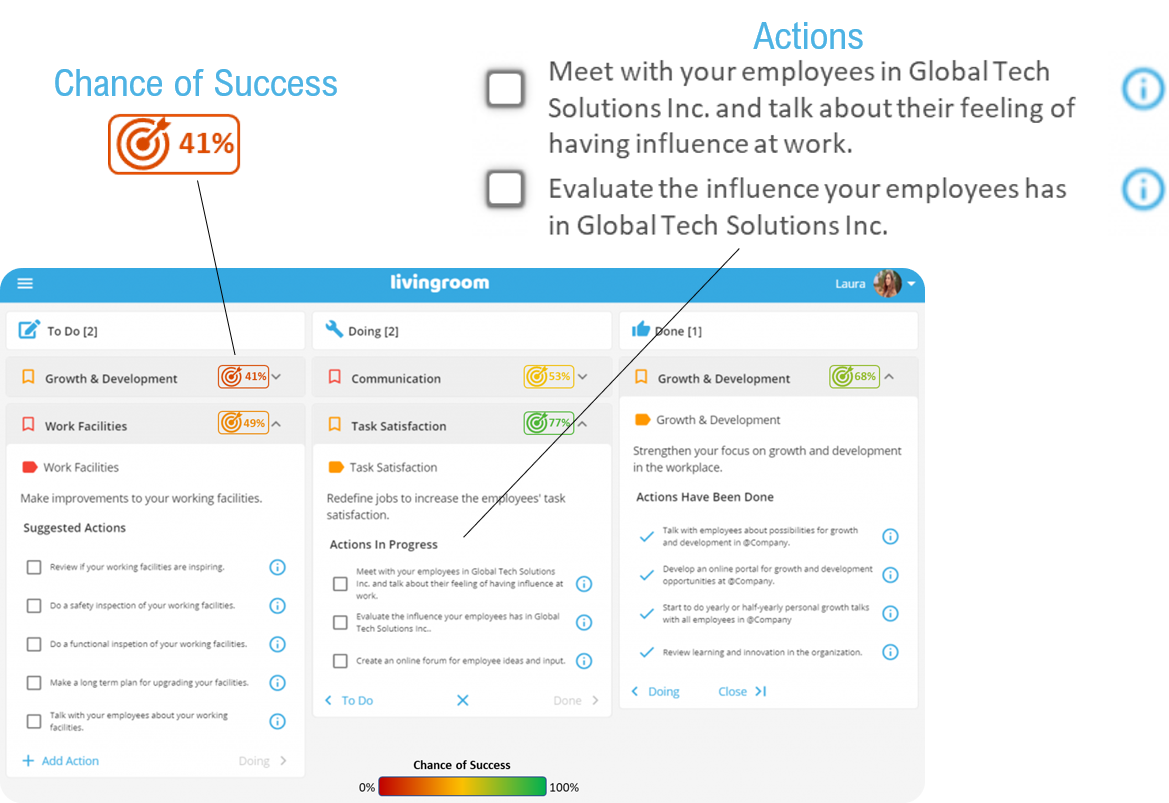
Organize Successful Action Plans
Using a visual Kanban board, Livingroom provides managers with a clear overview of actions for improving employee experiences. Helping managers organize and implement actions, the visual board also nudges managers to take action, highlighting progress and predicted chance of success.
